

White Wine Quality
Role: Data Analyst
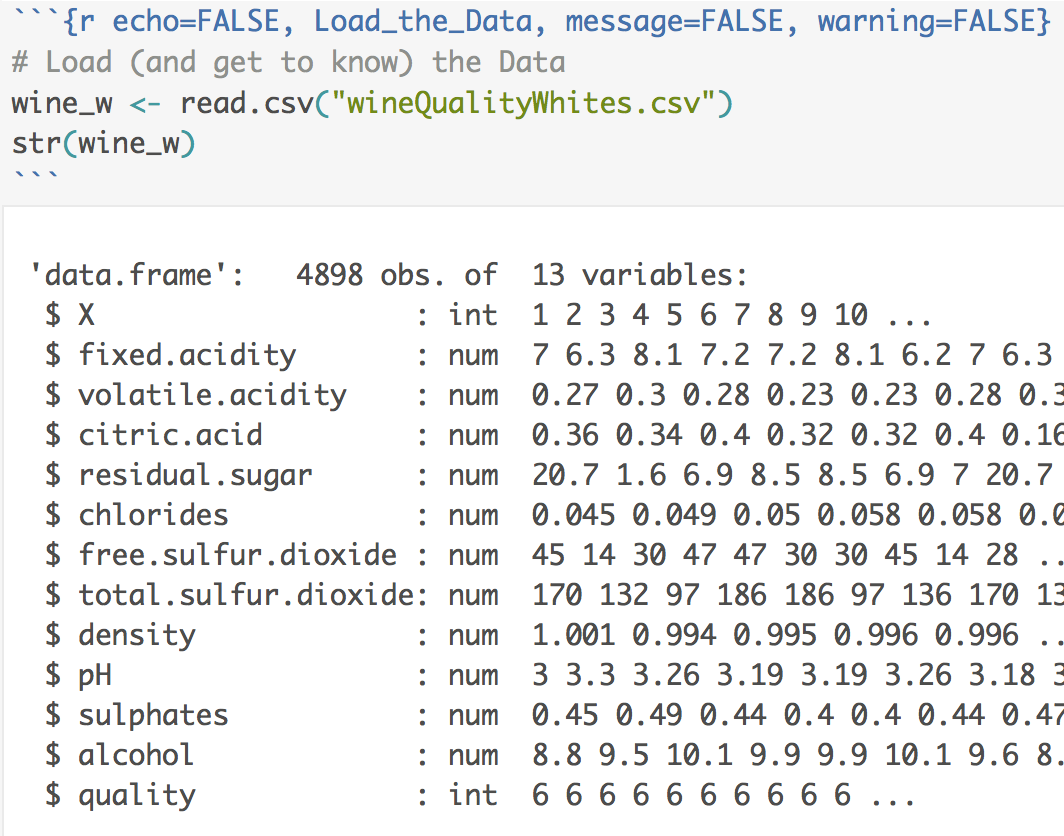
Tools Used: R, RStudio
GOAL
A wine producer must choose between 3 white wines to enter into a contest. The objective is to uncover which wine characteristics are associated with higher ‘quality’ ratings to predict which has the best chance of winning.
WHAT I DID
Examine nearly 5,000 white wines
Quantify relationships between wine characteristics and quality
Apply exploratory data analysis techniques
View the full White Wine Quality Report
Introduction
What determines wine ‘quality’?
Judging wines can be complex and subjective. People have different tastes, tolerances, sensitivities, senses, likes, and dislikes. Other factors can also affect our impressions: are we eating or drinking anything else? Is the wine at the correct temperature? What is the shape of the glass?
Subjective as it may be, wine does have components that can be quantified such as balance and depth. Balance is the relationship between sweetness, acidity (sourness), tannins (bitterness), and alcohol. With a balanced wine, one component doesn’t overpower another. Wine has depth when it doesn’t taste flat, or one-dimensional. At least three wine experts gave each wine in our dataset a ‘quality’ rating.
The goal of this report is to understand which properties are associated with high quality ratings: Alcohol content? Sugar content? Preservative content? These are just three of the 11 chemical properties contained in our dataset and are explained in the next section.


PROCESS
Univariate Plots: I started by exploring each variable and studied their distributions.
Quality: 0 (bad) to 10 (excellent). These values range from 3-9. The most common rating is 6.
Alcohol (%): percent alcohol (ethanol) by volume. Most wines (75%) have less than 11.4%.
Residual Sugar (g/L): sugar content. Sweeter wines contain more sugar. Most wines (99%) have less than 20 g/L.
Chlorides * (g/L): salt content. In high concentration can impart an undesirable salty taste. Most (99%) contain less than 0.05 g/L.
Density (g/L): mass per unit volume as compared to water (density = 1). Ethanol is less dense than water, and adding sugar to a liquid increases its density. Most values in our dataset are just below 1 due to the alcohol.
Acids add depth and flavor to wine. There are two types: fixed and volatile (evaporates more easily). Most acids are fixed, and the main ones found in white grapes are tartaric, citric, and malic. Malic acid is not included in our dataset but contributes to the apple flavor in wine.
Fixed Acidity (g/L): tartaric acid, the most important fixed acid, maintains chemical stability and color and influences taste. Most values (75%) are below 7.3 g/L.
Citric Acid (g/L): common in citrus fruits and found in minute quantities in grapes. It adds freshness but is less frequently used since it imparts a citrus flavor to the wine. Most values (75%) are below 0.39 g/L
Volatile Acidity, VA * (g/L): acetic acid is the most notable of the volatiles and mostly found in vinegar. At elevated levels will make the wine smell and taste like vinegar (a flaw!). Most values (75%) are below 0.32 g/L.
pH: pH scale ranges from 0 (acidic) to 14 (basic). All wines lay on the acidic side of the pH spectrum, around 2.5 to 4.5. Most values (75%) fall below 3.28.
Sulfites refer to sulphur dioxide (S02) in various forms. They act as preservatives: antioxidants and antimicrobials that prevent bacteria and other yeasts from growing. They protect a wine’s color, flavor, and freshness. Only a proportion of sulfites added to wine will be effective (‘free’), the rest combine with other elements in the wine and render them useless (‘bound’).
Sulphates (g/L): potassium sulphate (free and bound), the most common sulfite additive. Most values (75%) are below 0.55 g/L.
Free sulfur dioxide (mg/L): the effective part of S02, maintains freshness. Most values (75%) are under 46 mg/L.
Total sulfur dioxide (mg/L): both free and bound forms of S02. Most values (75%) are under 167 mg/L.
Ratings: I created a new variable dividing the quality rating into 3 categories: Bad (3-5), Good (6), and Fair. (7-9)
* flaws
Bivariate Plots: Next I examined the relationship between each variable and quality, then combined variables to explore how they relate to each other.
Relationships between Each Variable and Quality
Alcohol and density have the highest correlations to quality, but are still only moderately correlated. Better wines have more alcohol, and the higher the alcohol the lower the density since these variables are related.
Most variables have weak correlations to quality (Pearson’s r < 0.3). Chlorides, volatile acidity, and total SO2 are the strongest of the weak correlations.
Higher quality wines have fewer flaws: chlorides (salt) and volatile acidity (vinegar).
The only positive correlations are alcohol, pH, sulfates, and free SO2. All others are negative.
Better wines have less sugar (are dryer).
Better wines have less fixed acidity (tartaric acid). I would assume the opposite since acids lend depth and flavor. However the correlation is weak, all wines are on the acidic side of the spectrum, and the best wines are well balanced between acidity, sweetness, tannins, and alcohol.
Relationships between Combined Variables
Density + Sugar: sugar naturally increases density.
Density + Alcohol: alcohol naturally decreases density (ethanol is less dense than water).
Sugar + Alcohol: sweeter wines have less alcohol. During fermentation, yeast converts sugar (the fructose and galactose in grapes) into alcohol. Dryer wines (more sugar converted) contain more alcohol (more product). Sweeter wines (more sugar remaining) contain less alcohol (less product).
Alcohol + Total SO2 (preservative): Since alcohol itself is a natural preservative, wines with more alcohol don’t require as much SO2.
Sugar + Total SO2 (preservative): Sweeter wines require more preservative to prevent secondary fermentation of the remaining sugar.
Multivariate Plots
I added an extra color layer, a quality rating of bad, fair, and good, to the plots. Limiting the rating to these three bins helped clarify how the different variables affected quality.


CONCLUSION
To maximize their chances of winning the contest, technically they should pick the wine with:
More alcohol
Less sugar
Fewer flaws: volatile acidity (vinegar) and chlorides (salt)
Less preservative (total SO2)
However, with the exception of alcohol, other variables have weak correlations so probably don’t directly affect quality. The best wines are a delicate balance of alcohol, sugar, acid, tannins, and other non-chemical factors. They should pick the wine they believe to be the most balanced.